Interactive Environmental Indicators Maps – https://www.canada.ca/
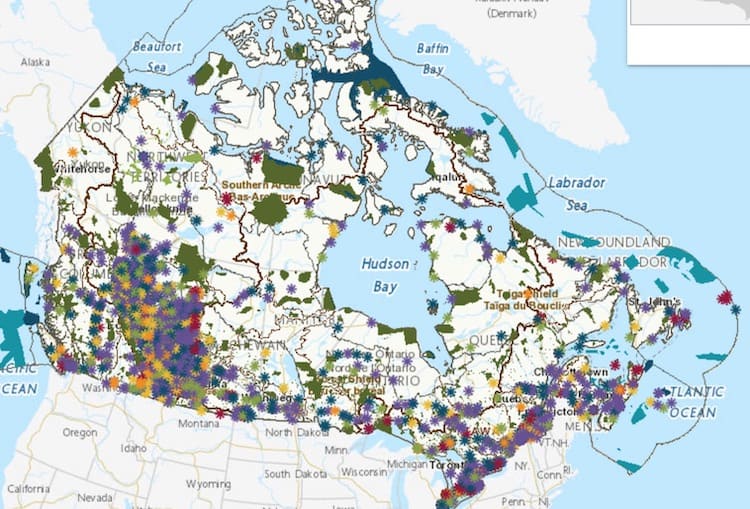
With over 25 datasets, this series of environmental indicator maps provides an extensive look at environmental conditions in Alberta and across the country.
The Canada interactive environmental indicator maps project is the culmination fo data from a variety of Government of Canada ministries. By selecting one data layer or many, this interactive maps provides a useful comparison of any region across the country.
Use the Canada interactive environmental indicator maps to explore data including:
- Air pollutant emissions
- Air quality
- Emissions of harmful substances to air
- Greenhouse gas emissions from large facilities
- Releases of harmful substances to water
- Water quality in Canadian rivers
- Water quantity in Canadian rivers
- Canada’s conserved areas

Recent Comments